
在過去七年間,美中關係持續走下坡。面對美中關係可能進一步惡化的擔憂,拜登總統和習主席於2023年11月在舊金山會面。這次會談代表了對不斷升級的緊張局勢的重要暫停,甚至可能是逆轉。是什麼避免了這兩個大國從戰略競爭升級到全面對抗?
我們提出兩個主要因素。首先,中國可能已經意識到中國經濟並不像北京先前所認為的那樣有韌性。在2008年全球金融危機之後,北京一直認為其中央控制的經濟模式能比西方經濟產生更優越的經濟增長。在2020年和2021年,COVID-19大流行打亂了美國和西方的經濟成長,但對中國造成的損害相對較小,增強了北京的信心。北京關於「東升西降」的論斷獲得了支持。然而,2022年中國實施的清零政策暴露出中國經濟更大的弱點,也導致了經濟停滯。在了解這些挑戰和穩定經濟的需求後,北京可能判斷直接挑戰美國的好處減少了。
其次,從美國的角度來看,2022年2月開始的俄羅斯-烏克蘭戰爭以及2023年10月開始的以色列-哈馬斯戰爭都是出乎意料且不歡迎的事件。這些事件加劇了美國對亞太地區衝突的厭惡情緒。為了避免與中國進一步的衝突,美國選擇用更友好的方式對待美中關係。舊金山的會議成功地緩和了緊張局勢,並在恢復軍事通信和打擊非法毒品等領域取得了進展。
在過去六個月間,美國和中國表現出了越來越多經濟道路上的分歧。儘管經濟衰退的警告不斷,美國經濟表現出韌性和卓越的經濟增長,目前的就業數據顯示美國經濟在2024年和2025年還有進一步的增長空間。考慮到強勁的經濟和頑強的通貨膨脹,2024年餘下的時間內,美國通膨和利率的走向將會如何?相反,中國經濟遭遇了多重挑戰。北京能夠及時實施有效政策,重振疲弱的中國經濟嗎?此外,在去風險化時代,國際貿易、投資和全球供應鏈將如何發展?我們的報告詳細探討了這些緊迫的問題。
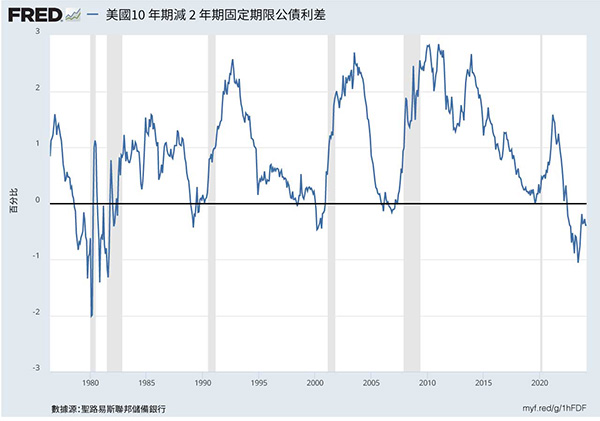
在過去五十年中,當美聯儲提高利率以遏制通脹和冷卻過熱的經濟時,往往會導致美國經濟衰退,尤其是殖利率曲線倒掛時(圖一)。然而,當前的貨幣緊縮週期似乎有所不同,而且預期短期內不會出現衰退。這一次為何不同呢?雖然原因包括與國債市場和金融市場相關的不明因素,但是我們探討的是實際經濟因素。
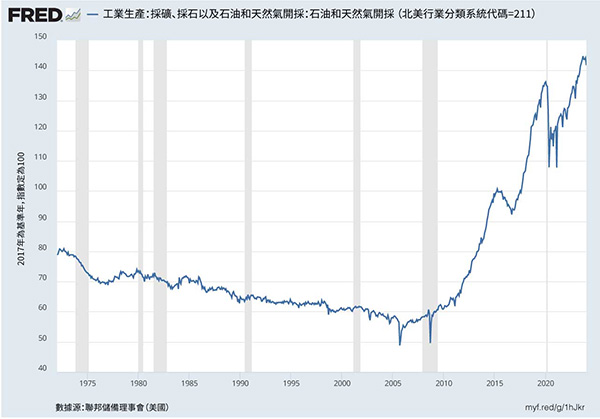
首先,受惠於先進的水力壓裂技術,美國頁岩油和頁岩氣生產正在復興。美國的石油與天然氣生產在COVID-19大流行期間受到了干擾,現在卻已達到歷史新高(圖二)。也許會讓有些人感到意外,但是美國現在是世界上最大的石油和天然氣生產國。近期供應的增加對於避免重複1970年代的停滯性通膨至關重要。2022年俄羅斯入侵烏克蘭後,西方對俄羅斯石油和天然氣的制裁產生了類似於70年代的負面供應沖擊,伴隨著更高的能源產量;這種生產量的增加穩定了汽油價格,抵消了供應限制造成的通膨壓力。
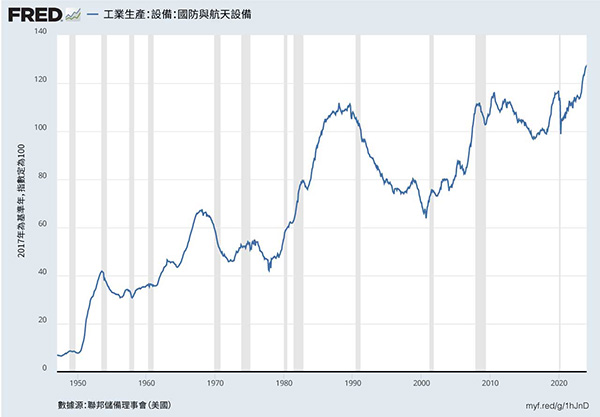
其次,位於烏克蘭和加薩地帶的衝突促使美國軍事和國防裝備產量在過去六個月內迅速增加,達到歷史新高(圖三)。這提振了美國 GDP,聯邦國防支出年增率從 2021/2022 年的 0% 左右上升到 2023 年的 7%。
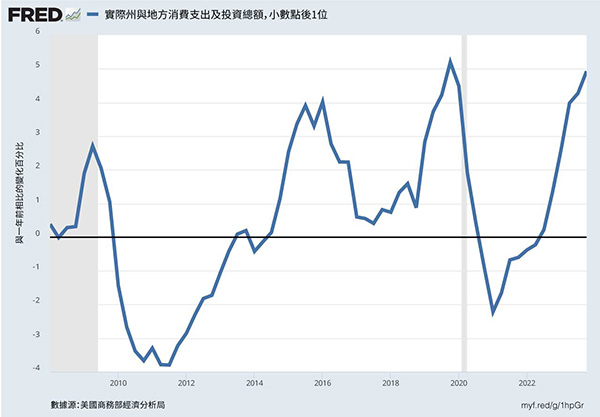
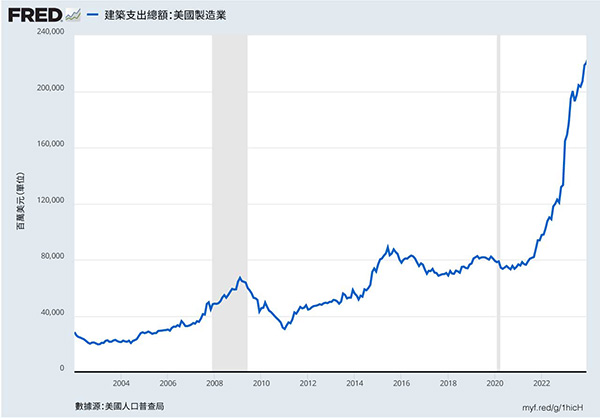
第三,2021年和2022年通過的重大法案,包括2021年的《基礎設施投資和就業法案》(IIJA)、2022年的《晶片和科學法案》,以及2022年的《通脹削減法案》(IRA),已經產生了刺激性的財政支出,並振興了美國的製造業和供應鏈的韌性。其影響已經體現在各州和地方政府的消費與投資的年度增長上,增長了4%(圖四)。此外,製造業的建築支出也顯著增加(過去一年增加了1200億美元),這抵消了大流行期間因遷移減少和抵押貸款利率上升所導致的住宅建設投資下降(圖五)。
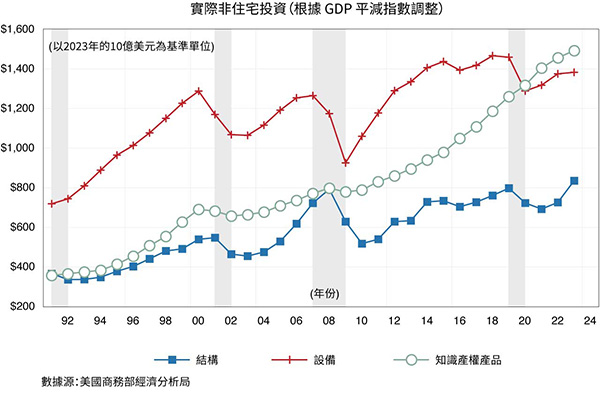
最後,儘管科技業裁員被廣泛報導,我們不能忘記人工智能科技公司成長的重要性,以及科技領域整體持續增長的重要性。這兩者都推動了股市屢創新高。圖六顯示了實際非住宅投資的三個主要組成部分,並根據GDP平減指數(以2023年十億美元為單位)進行了通貨膨脹調整後的數值。正如我們先前提到的,有別於2000年和2008年先前的緊縮週期,我們並未看到對設備(紅線)和結構(藍線)的總體資本投資出現下降。此外,我們看到對軟件和知識產權產品(綠線)的投資持續增長。值得注意的是,這個較不受利率影響的組成部分,已成為非住宅投資中最大的元素。
照我們觀察,這些因素是美國經濟韌性的重要推手,且在短期內很可能保持積極發展或維持現狀。此外,我們預期重大的人工智能投資將在未來增強生產力。展望未來,我們預估經濟將保持穩定的2.5%成長趨勢。隨著通膨率持續高於2%,以及經濟按其潛力成長,我們預測美聯儲在2024年將維持遠高於4%的短期利率。
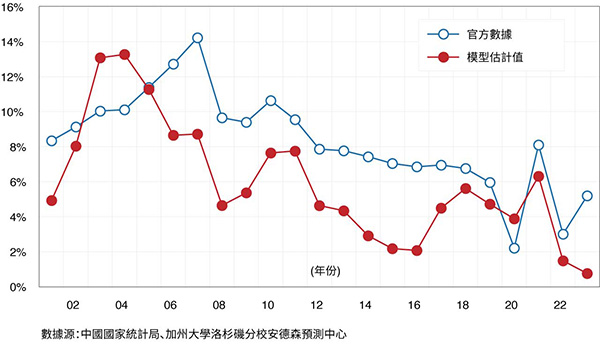
儘管去年關於中國經濟的負面新聞不斷,包括消費需求疲軟、製造業不景氣和住宅建設急劇下降,但中國政府報告稱,2023年國內生產總值(GDP)增長為5.2%。這一數字與大眾的看法形成鮮明對比,使人質疑中國官方統計數據的準確性。事實上,任何展現以上特徵的西方經濟體幾乎肯定會陷入衰退。加州大學洛杉磯分校安德森預測中心(UCLA Anderson Forecast)開發了一個簡單的替代模型來評估中國的GDP增長1。該模型考慮了四個關鍵變量的年增長率。在2023年,這些數據分別是:能源消耗估計增長4.3%,二氧化碳排放增長2.5%,總貿易(出口和進口相加)為 -5.3%,以及房價增長為 -30%。根據安德森預測中心的模型,2023年中國的GDP增長率估計為0.8%,這一數字遠低於中國官方的估計,且考慮到預測誤差,與0.0%無顯著差異。
圖七展示了我們的模型對中國歷史GDP估計(紅線)與中國國家統計局官方數據(藍線)的比較。顯然,與官方數據相比,我們的估計顯示出持續較低的增長率。值得注意的是,我們的模型將2023年中國房價的變化率設為 -30%,反映了中國房地產業的動盪,主要開發商如恒大正面臨清算,碧桂園同樣遭遇清算申請。然而,如果我們將中國官方的70個城市平均房價下降4%視為全國代表性數據,我們的模型推算中國的GDP增長為3.1%。儘管4%的下降可能是準確的,但它並不反映背後的市場價格。相反,中國政府採取干預措施,支持瀕臨倒閉的房地產公司,並將住宅單位從市場中撤出,掩蓋了本該急劇下降的房價。
比較美國和中國的房地產ETF能夠凸顯中國房地產市場的困境。例如,2022年和2023年,先鋒美國房地產ETF(VNQ)的增長率分別為 -21%和 +7%,而MSCI中國房地產ETF(CHIR)的增長率則分別為 -30%和 -37%。
圖八展示了中國房地產泡沫及其後來爆破的規模。該圖顯示了從1995年開始可獲得的數據,美國和中國的直接住宅投資佔GDP的百分比。美國在過去一個世紀的住宅投資平均約佔其GDP的4.5%(虛線),僅在1950年(6.9%)和2004至2006年期間(高峰時達到6.6%)在其房地產市場崩潰之前超過6%。雖然美國和中國的住房市場之間存在明顯差異,如中國近年的城市化,但我們任意假設6%作為房地產泡沫的指標閾值。依此為衡量標準,中國的房地產市場自2006年以來,一直處於過度投資狀態。以中國平均住房面積80平方米計算,自2011年以來,中國每年建造超過800萬套住宅。截至2023年12月,中國仍有7300萬套在建住宅。
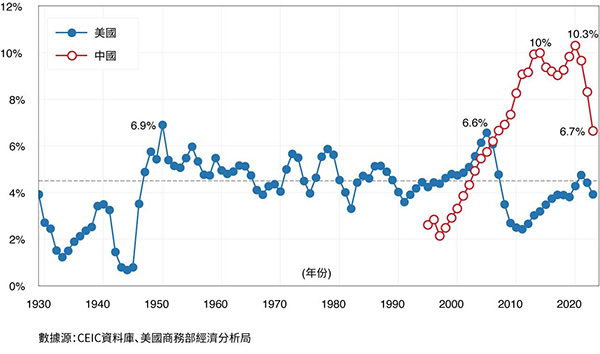
在美國房地產泡沫破裂的最初三年(2006至2008年),房地產投資佔GDP的比例下降了3.1個百分點(從6.6%下降到3.5%)。中國房地產市場崩潰也出現了類似的模式,房地產投資佔GDP的比例下降了3.6個百分點(從2020年的10.3%下降到2023年的6.7%),按平方米為計算的房屋動工數量從2019年的峰值下降了58%。以美元現值計算,這相等於下降了22%,按購買力平價計算,則下降了11.7%。對於美國來說,這種規模的下降在過去八十年六次伴隨著衰退,僅兩次未出現衰退。
其中一個例外是在1966年,當時為越南戰爭的準備造成實際國防開支在佔GDP 9.6%的基礎上增長了11%。預計中國將在佔GDP 1.6%的基礎上增加7.2%的國防開支,對經濟的需求影響顯著較小。第二個例外是2006年底,房屋建設的崩潰最終導致了2008年初的經濟大衰退。中國目前的住宅投資水平仍然很高,意味著可能會出現進一步的下降,如2006年美國那樣。這些數據加上中國人口減少的情況,令人懷疑中國的房地產危機能否在避免經濟增長減緩或負增長的情況下得到解決。
與股市崩盤不同,房地產行業嚴重依賴債務,開發商和購房者通常通過貸款和槓桿融資。隨著房價下跌,資產負債表的一側價值減少,而另一側的名義債務保持不變。這種失衡讓借款人和貸款人難以維持清償能力或恢復財務健康。因此,即使在低利率環境下,家庭、企業、地方政府和銀行也會猶豫不決,不願進行新的借貸或貸款活動。在房地產泡沫破裂後,日本花了近三十年,美國花了約八年時間才在財務上恢復。我們預測中國需要一個介於兩者之間的恢復期,也許是十到二十年。
北京政府能否像過去那樣進行干預,並重新點燃經濟增長?這一次,前景似乎令人懷疑。自2008年全球金融危機以來,北京一直依靠財政刺激來振興其放緩的經濟,尤其是在2008/2009年、2011/2012年和2016至2020年期間。這些干預導致房地產泡沫日益擴大、基礎設施網絡不斷擴張和製造設施產能過剩。
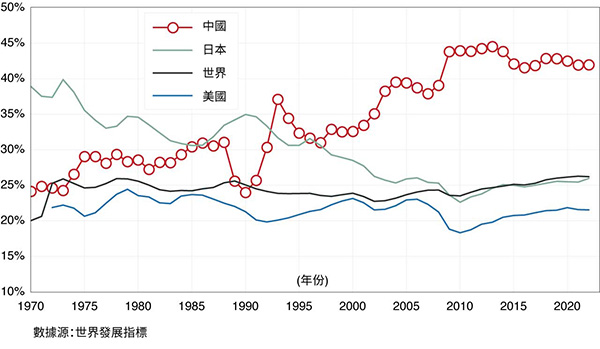
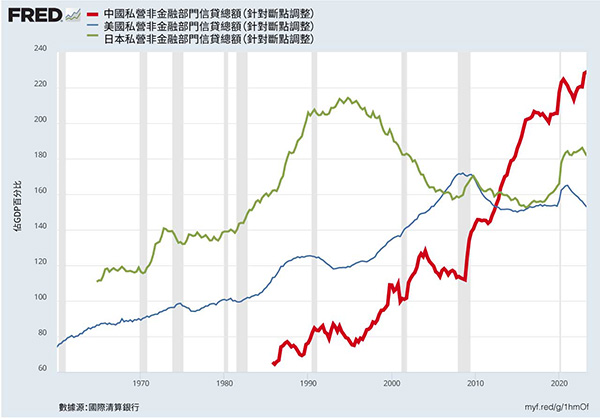
圖九展示了美國、中國、日本和世界的投資(固定資本形成總額)佔GDP的百分比。雖然房地產、基礎設施和工廠投資全球的平均水平約為GDP的25%,但中國的投資率自2002年以來一直超過其GDP的35%,2008年後更是超過40%。如此不成比例的投資水平導致資源錯配、回報減少甚至為負,以及債務負擔加劇。中國的過度投資模式無論是規模還是持續時間都比1970年代和1980年代日本的狀況更為嚴重。圖十顯示,自2008年以來,中國持續而廣泛的過度投資加速了其私營部門債務的累積,在2023年達到GDP的228%。包括政府債務在內,中國的債務與GDP比率上升到307%,顯著高於美國的253%和G20平均的248%。總之,中國持續的投資,儘管可能出現負回報和債務加劇,是不可長期持續的。
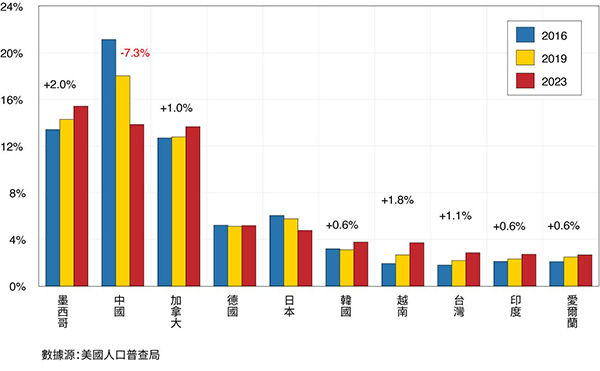
在先前的報告中,我們討論了美中戰略競爭的動態及隨之而來的去風險化。本報告呈現了全球供應鏈正持續轉型以及擺脫以中國為中心的貿易模式的證據。圖十一突顯了這一轉變:在2016年(美中貿易摩擦之前),中國是美國的主要進口來源,佔進口額的21%。到了2023年,這一數字下降至14%,減少了7.3個百分點。相反,從墨西哥的進口從2016年到2023年上升了兩個百分點。現在,在近岸外包和《美墨加協定》(USMCA)的原則下,墨西哥已成為美國最大的進口來源。對中國的依賴減少,加上現有的關稅,導致進口來源多元化到其他地區,如加拿大(從2016年到2023年增加了1%)、韓國(+0.6%)、越南(+1.8%)、台灣(+1.1%)和印度(+0.6%)。這種策略通常稱為“友岸外包”,是一個真實且持續的過程。在中國方面,官方正式採取措施以國產軟件替代西方軟件,包括操作系統和應用程式。這將加速減少中國與西方之間的外國直接投資和服務貿易。
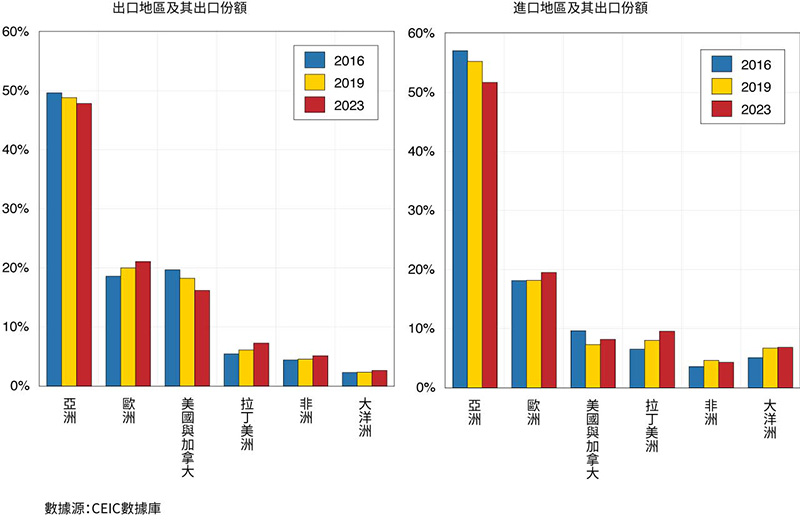
圖十二提供了中國出口和進口地區變化的洞察,以及它們在2016年、2019年和2023年的各自份額。儘管中國對美國的出口份額有所下降,但美國仍然是中國最重要的出口市場和其貿易順差的主要來源。目前,中國正積極尋求增加對歐洲、拉丁美洲和非洲的出口。由於中國商品生產過剩,貿易的緊張局勢未來可能會升級。這在電動車(EV)和太陽能板行業尤其嚴重,因為這些行業的產量已經超出了國內市場的吸收能力。舉例來說,歐盟委員會正在調查中國製造的廉價電動車是否存在因國家補貼而產生潛在的不公平優勢,以決定是否實施報復性關稅。
雖然圖表中未有顯示,但中國從俄羅斯的進口份額顯著增加,從2019年的2.9%上升到2023年的5.1%。同樣,中國對俄羅斯的出口也從2%增加到3.3%。隨著俄羅斯因入侵烏克蘭而受到西方制裁,中國增加了來自俄羅斯的能源進口並增加了商品和設備的出口。由於對俄羅斯的制裁短期內不會結束,這種中國貿易的轉變預計將會持續。
總而言之,中國經濟面臨三大結構性挑戰。首先,過度投資的後果以及房地產泡沫破裂是根深蒂固的問題,需要較長時間來解決。其次,美國和中國之間不斷加劇的戰略競爭限制了中國接觸西方先進技術的機會。這種緊張局勢導致外國對中國的直接投資顯著減少,許多製造商將其業務轉移到其他地區。第三,在習主席的統治下,中國經濟模式更加趨向由國家控制。這一轉變加上北京在政策、監管和控制措施上的不確定性,使得企業、個人和資本市場變得謹慎,並越來越多地搬離中國。這些挑戰不僅僅是短期或週期性的;它們預示著中國未來十年的經濟前景可能十分黯淡。
在第二次世界大戰後的四十年間,日本的經濟增長被視為計劃經濟的奇蹟。其經濟增長主要是由高儲蓄率支持對現代資本財貨的大量投資所推動。但隨著時間的推移,這些投資的回報下降了,儲蓄流入了房地產泡沫。泡沫破裂後,日本陷入了緩慢增長的時代,在後來被稱為「失落的十年」2。如今,中國也處於類似的境地。從1980年代中期起,高儲蓄率推動了一段顯著的經濟增長期。投資回報下降、房地產泡沫以及人口減少的情況都驚人地相似。若不想2020年代成為失落的十年,中國必須找到一種方式激發創新和增長,即使與曾經通過出口為中國帶來繁榮的國家(包括美國)的經濟聯繫減少。即便正在與中國經濟脫鉤,美國經濟仍在帶領發達國家的經濟增長。隨著差距的擴大和中國感到越來越與西方孤立3,經濟機遇的新現實將直接影響到兩國之間的投資和貿易。
在國泰銀行贊助出版的《美中經濟報告2022》中,加州大學洛杉磯分校安德森經濟預測中心(預測中心)提供他們對美中這兩大世界經濟體的當前與未來的分析及觀點。
逾65年以來,預測中心一直是分析美國和加州經濟的領先的獨立經濟預測機構。年度報告及定期更新側重於影響美中之間投資行為與資金流動的相關事件。
本報告中的預測性陳述,是來自預測中心根據當時可獲得的資訊,對美國及中國當前及未來經濟狀況的分析及觀點。這些預測乃考慮到業界趨勢與其他因素所作出的,且包含了風險、變數與不確定性。此資訊以概述方式呈現,並未宣稱資訊完整。本報告中的資訊不應被視為採取特定行動的意見或建議,且並不考慮任何特定業務目標、財務狀況或需求。
在此提醒讀者不要過度依賴前瞻性陳述。報告發表後,預測中心不負責公開發表對這些前瞻性陳述的任何修訂結果。儘管已謹慎準備預測資訊,實際結果可能會有正面或負面的實質性差異。預測與假設範例可能因預測中心控制以外的不確定性與偶發事件受到影響。
Jerry Nickelsburg在2006年時加入加州大學洛杉磯分校的安德森管理學院及安德森預測中心。自2017年起出任安德森預測中心總監。他也在工商管理碩士課程中教授經濟學,關注企業預測與亞洲經濟。他擁有明尼蘇達大學的經濟博士學位,並曾就讀於維吉尼亞軍校以及喬治華盛頓大學。他在經濟學與公共政策有關的言論獲廣泛發表及引用。
William Yu在2011年以經濟學家的身份加入加州大學洛杉磯分校安德森預測中心。他在預測中心主要負責的領域包括經濟建模、預測與洛杉磯經濟。同時也從事中國經濟以及其與美國經濟的關係研究與預測。他的研究主軸包括諸如時間序列計量經濟學、數據分析、股票、債券、房地產與商品價格動態、人力資本與創新等廣泛的經濟金融問題。

