
Since the Trump Administration’s “Liberation Day” tariff announcement on April 2, the U.S. and its trading partners have experienced a turbulent period marked by abrupt policy shifts, pauses, and continued uncertainty. Following a 90-day holding period during which a uniform 10% global tariff was applied, new reciprocal tariff rates were finalized and implemented in early August. These rates vary by country, depending on the extent of bilateral trade imbalances and the outcome of negotiations. Key examples include: the U.K., Australia, and Singapore at 10%; the European Union, Japan, South Korea, Israel, and Turkey at 15%; Malaysia, Thailand, the Philippines, Indonesia, and Cambodia at 19%; and Taiwan and Vietnam at 20%.
At the high end is China, which faces a steep 55% total tariff, consisting of a 25% Section 301 tariff, a 20% fentanyl-related tariff under IEEPA1, and a 10% reciprocal tariff, which remains in effect under a truce extended through November 2025. The Chinese government has reacted with higher tariffs on imports, though its countervailing duty reaction has been somewhat mild. More importantly, industrial policy has bolstered investment in technologies that will substitute for currently imported U.S. goods. Current talks between the two countries are now focusing on non-tariff barriers to trade.
As shown in Figure 1, the effective U.S. tariff rate—defined as total tariff revenue divided by the value of imported goods—has increased significantly, reaching approximately 10% in recent months, and is projected to climb to 15% with the August implementation of new reciprocal tariffs. Despite these developments, most major trading partners have refrained from retaliation, with China as the sole exception. Absent this restraint, the global economy might have faced additional significant disruption. These tariff actions reflect a broader strategic shift away from the post–Cold War model of free trade toward pre-war neo-mercantilist trade regimes2. The shift appears poised to persist beyond the current administration because many policymakers from both parties are likely to view tariffs not only as instruments of industrial policy but also as tools to mitigate chronic trade and fiscal deficits. Moreover, there is the potential for annual tariff revenue to exceed $300 billion in attractive new revenue, lessening the impact of the fiscal deficit.
However, legal challenges have resurfaced. Just as markets were beginning to adjust to the new tariff reality, an appellate court struck down key parts of the Trump Administration’s global tariff framework—specifically those based on IEEPA—sending the issue to the Supreme Court. A decision is expected later this year. If the Court overturns the policy, it could trigger a new wave of uncertainty, as the administration scrambles to find alternative legal tools to revive its trade agenda. That said, the overall policy direction remains unchanged: tariffs are likely to be a central part of U.S. economic strategy for the foreseeable future. As shown in Figure 2, economic policy uncertainty, which includes tariff policy as well as other economic policies, has declined from a record high of 460 in April to 233 in August, but it still remains elevated by historical standards.
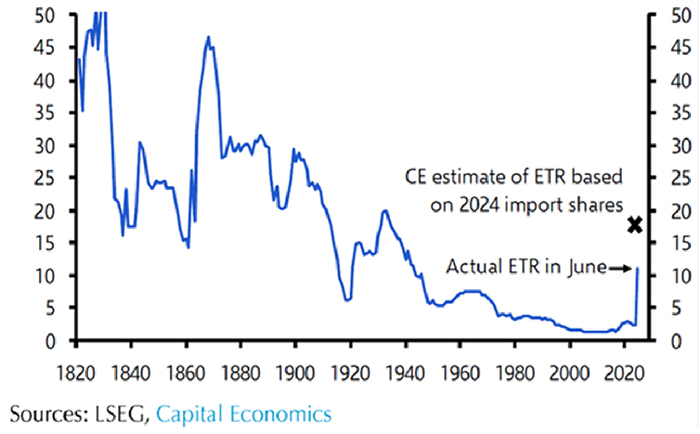
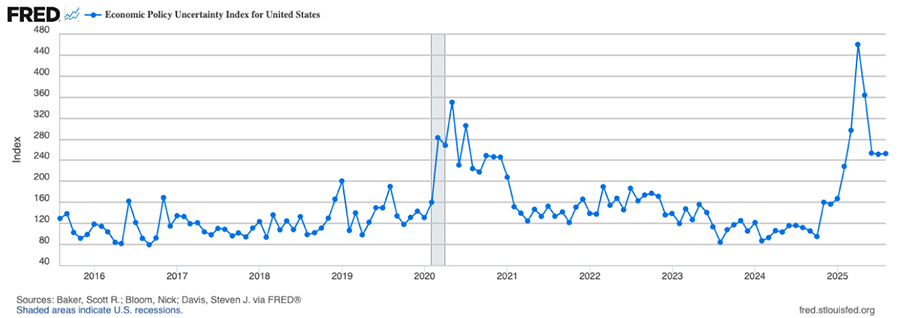
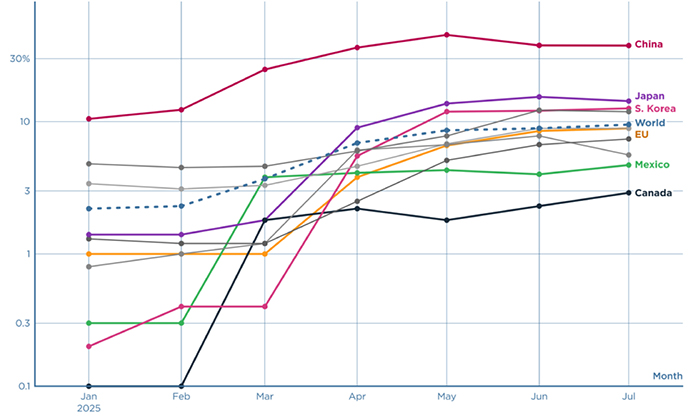
Figure 3 shows the effective tariff rates the U.S. maintains with its major trading partners. As of July, China is the most heavily affected, facing an effective tariff rate of approximately 38%. Japan follows with a rate of 14%. Notably, Mexico and Canada have significantly lower effective rates—below 5%—despite widely publicized headline tariffs of 25% and 35%. This discrepancy is due to a large portion of their exports qualifying for duty-free treatment under the USMCA agreement, allowing them to enter the U.S. market without tariffs.
This variation in tariff rates reveals two key trends. First, while the Trump administration’s tariffs aim to bring manufacturing back to the U.S., near-shoring to Mexico and Canada remains an attractive alternative for many firms. However, this strategy could become riskier starting in 2026, when the USMCA agreement is up for renegotiation. Second, rising strategic competition and national security tensions between the U.S. and China are accelerating the broader push toward economic decoupling and supply-chain de-risking. This helps explain why China continues to face the highest tariff levels. Although trade negotiations between the U.S. and China are ongoing ahead of the U.S.-imposed November 10 deadline, elevated tariffs on Chinese goods will likely remain in place, regardless of whether a near-term agreement is reached.
A key signal of the U.S. commitment to diversifying away from China-centric supply chains is the newly implemented 40% penalty on transshipment, which applies broadly but is especially concentrated on countries like Vietnam, Malaysia, Thailand, Indonesia, and the UAE. These economies are increasingly viewed as intermediaries for Chinese exports attempting to bypass tariffs. If there were an intention to normalize China’s tariff rate in line with other countries in the future, there would be little rationale for imposing such a steep penalty on these transshipment routes. The targeted nature of this policy indicates that the U.S. sees Chinese-origin goods, even when rerouted, as a central concern in its trade strategy.
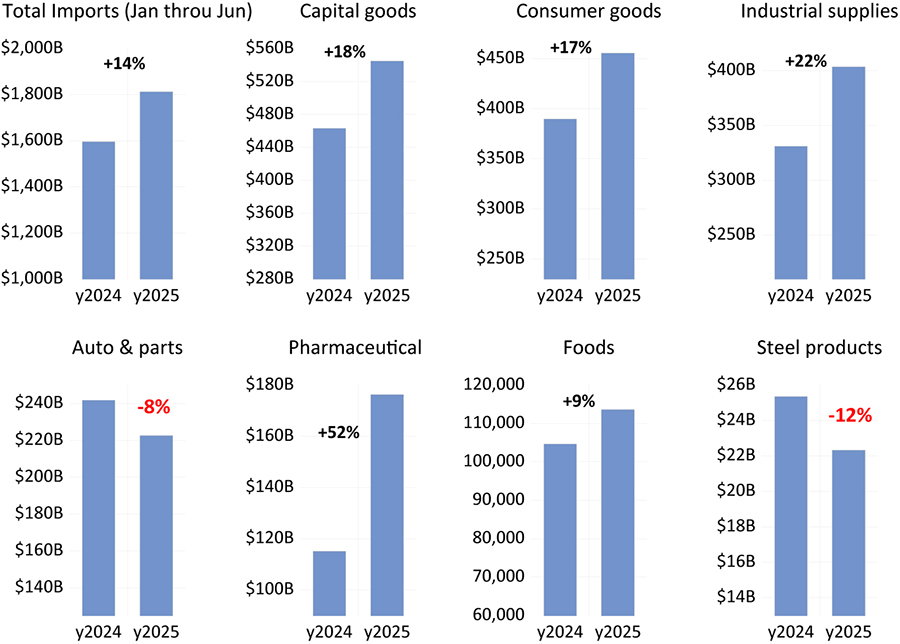
Figure 4 illustrates the sectoral impact of tariffs on U.S. imports through June. The left bar reflects import values during the first six months of 2024, while the right bar shows the same period in 2025. Surprisingly, total imports rose by 14% year over year. This seemingly paradoxical increase is best explained by frontloading: many importers accelerated their shipments in anticipation of higher tariffs later in the year, thereby avoiding new rates. Steel products, cars, and auto parts were the exceptions. Steel imports fell by 12% and auto-related imports declined by 8%. These categories were subject to Section 232 tariffs that were fully implemented in March and April, which left little room for frontloading in advance of enforcement.
Looking ahead, two additional sectors—pharmaceuticals and semiconductors—are expected to be brought under Section 232 of the Trade Expansion Act of 1962, which authorizes the President to impose tariffs for national security reasons. The planned approach for these sectors is to implement a gradually phased-in tariff increase, which will provide time for foreign direct investment and the development of domestic manufacturing capabilities. To maintain supply chain continuity and minimize disruption, it is expected that foreign manufacturers who are actively building production facilities within the U.S. will be exempt from future Section 232 tariffs. Overall, these tariffs are expected to reduce imports and encourage the expansion of domestic production in both sectors.
Our forecast, similar to the annual report released in April 2025, is that the U.S. economy is slowing in the near term under the weight of heightened tariffs, uncertainty around deportations, and federal spending cuts. Over time, however, factors such as deregulation, AI-driven investment and productivity gains, increased foreign investment, reshoring, and tax cuts are expected to support stronger growth by 2027. For a more detailed assessment of the U.S. economic outlook, see our colleague Clement Bohr’s June article, “A Tariffying Amount of Uncertainty3” as well as his upcoming U.S. economic report, “A Summer of Inflection Points,’ which will be released October 1. This report will focus on interest rates and monetary policy.
The Federal Reserve now faces a dilemma: Should it continue to cut interest rates after the 25-basis point cut in its September FOMC meeting to support a weakening labor market, or hold steady thereafter to fight rising inflation? Figure 5 shows the monthly change in nonfarm payrolls. In August, only 22,000 jobs were added—a disappointing figure following three consecutive months of similarly soft gains. Yet, the labor market is more dynamic than it might seem. In August, there were 5.3 million new hires, amounting to 3.2% of total employment (blue line in Figure 6). At the same time, 2% of workers quit their jobs (green line), and 1% were laid off (red line). Compared to historical norms, the weakness lies in the hiring rate, which has dropped to levels last seen in 2014. Several factors may be contributing to this slowdown, including: (1) Tariff-related uncertainty, (2) Disruptive impacts of AI adoption, and (3) High interest rates, which may be dampening business confidence and investment. This situation is further complicated by a labor force disrupted by deportations or the looming threat of them.
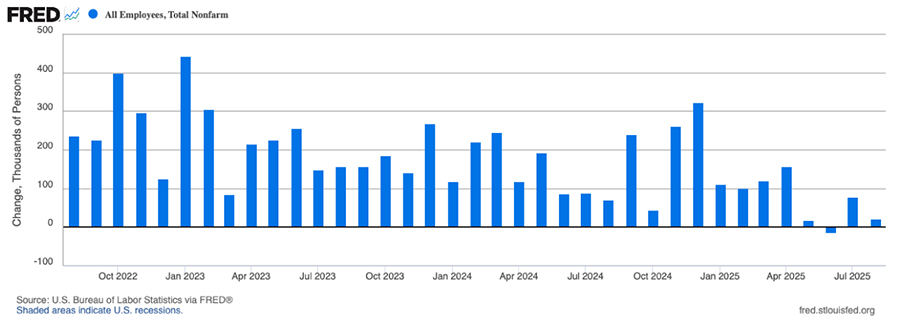

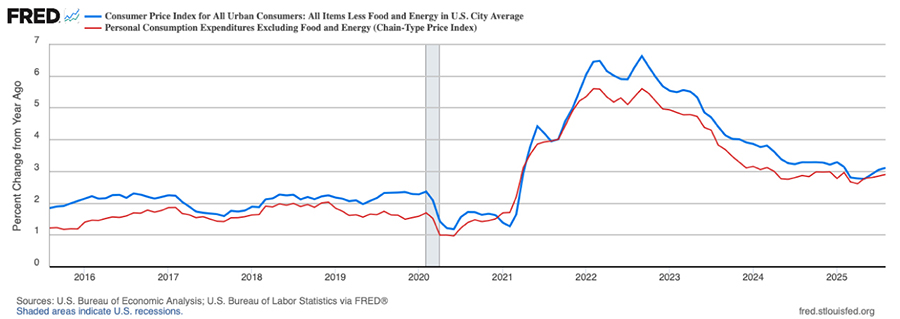
Figure 7 shows two core inflation measures ticking up over the past three months. Core CPI inflation has returned to above 3% after dipping below that level between March and June. If the Fed were to continue to cut rates, the risk is that it could add fuel to inflationary pressures. However, in his recent Jackson Hole speech, Chair Powell emphasized that tariffs are more likely to raise the one-time price level than to drive a sustained increase in the inflation rate.
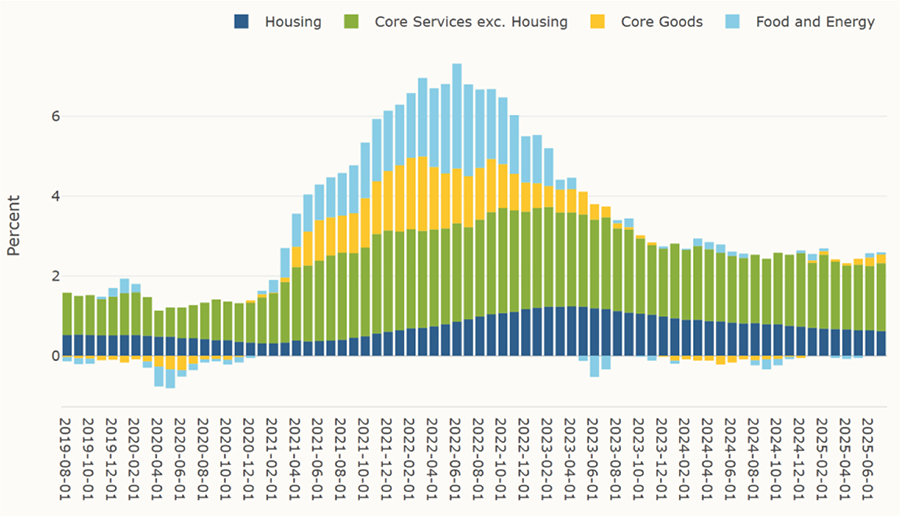
Figure 8 breaks down year-over-year inflation since 2019 into four main components: housing (dark blue, largely rents), core services excluding housing (green), goods (yellow), and food and energy (light blue). The primary drivers of inflation over the past two years have been housing and services, with goods playing a limited role. More recently, goods inflation has inched up due to tariffs, which could push prices higher over the next year. Even so, the likely impact is a one- to two-percentage-point increase in the PCE price level, not a prolonged surge in inflation.
Turning to products already experiencing reduced imports under the Section 232 tariffs implemented last March and April. Figure 9 shows the domestic producer price index for steel products. Between February and August, steel prices rose by 9% and the dollar weakened by 6%, which combined is well below the headline 50% tariff. Currently, nominal steel prices seem to be stabilizing. At the same time, the import price index for steel—measured in dollar terms and excluding tariff costs—declined by 6% over the same period. Meanwhile, domestic steel production rose by 3%. Clearly, at least 35% of the tariff is being borne by foreign producers of steel and 15% by U.S. customers. The production overcapacity of steel, particularly, has put downward pressure on current prices, however, marginal producers in China and elsewhere will ultimately have to cut back production rather than take continued losses.
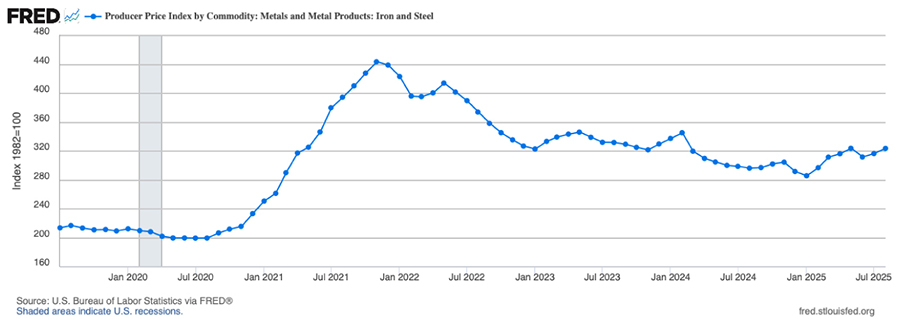
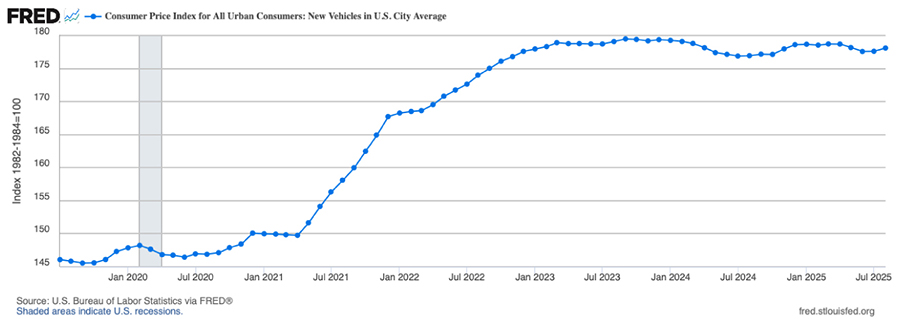
Figure 10 displays the domestic consumer price index for new vehicles, which has remained relatively flat since February. This indicates that foreign producers and importers are actively absorbing the added cost of tariffs rather than fully passing them on to consumers. One likely reason is their desire to maintain market share in the U.S., even if it means narrowing profit margins or selling out of pre-tariff accumulated inventory. As with steel, ultimately, the marginal products will leave the market, and prices will increase later. In both cases, higher prices should lead to increased domestic manufacturing.
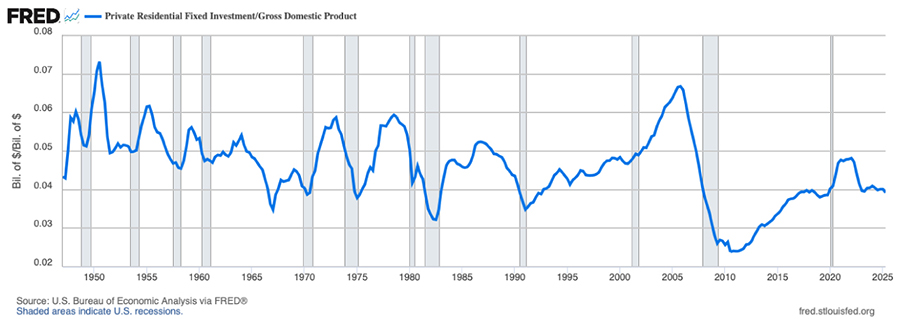
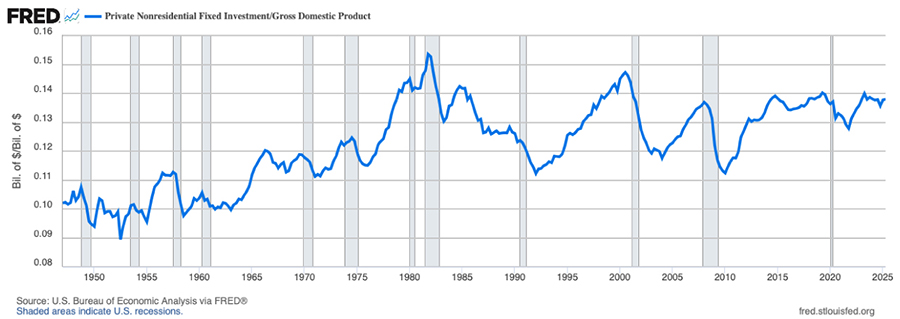
Figure 11 shows residential investment as a percentage of GDP, which currently stands at around 4%—a relatively low level by historical standards. As a result of high borrowing costs, total construction spending has declined over the past year. In contrast, another category of investment is helping to support the economy despite the headwinds of high interest rates and tariff uncertainty. Figure 12 displays non-residential fixed investment as a share of GDP, which is now at a historically high level, with much of it driven by AI-related spending. One striking example is construction spending on office buildings, which has reached an all-time high of approximately $105 billion. This may seem counterintuitive, given the ongoing weakness in commercial real estate markets due to elevated interest rates and the persistence of remote work. However, most of this spending falls under the category of data center infrastructure. If we also account for AI chips and related equipment, the total AI-related capital investment could reach an additional $200 billion in 2025 alone.
At the same time, corporate profits after tax remain at historically elevated levels, totaling $3.3 trillion, or between 10% and 11% of GDP. This indicates that U.S. corporations—particularly Big Tech firms—have ample resources and liquidity to sustain large-scale AI investments. Companies like OpenAI, xAI, Google, Meta, Amazon, Apple, and Microsoft all recognize the transformative potential of AI and are determined not to fall behind in this technological race. Given this strategic imperative and financial capacity, we believe AI investment is likely to continue at a strong pace for the foreseeable future.
As shown in Figure 3, China has been the country most severely affected by Trump’s tariff waves, despite recent de-escalation efforts and trade negotiations. This impact is evident in Figure 13, which illustrates how U.S. imports from China plunged from $42 billion in January to $19 billion in June, and modestly rebounded to $26 billion in July. The import value has fallen to levels not seen since 2005, even before adjusting for inflation over the past two decades.
In response to the American tariff pressure, China has supercharged its manufacturing capacity and export engine. As of Q2 2025, China’s fixed investment remains elevated at 42% of GDP despite the collapse of its real estate market. By comparison, the U.S. economy in 2025 features an AI investment boom with nonresidential investment only at 14% of GDP (Figure 12) and residential investment at 4% (Figure 11). This comparison underscores the unbalanced and investment-heavy nature of China’s economic model. In August 2025, China’s year-over-year growth in manufacturing investment was at 5%. To supply its expanding industrial base with low-cost energy, China is also heavily investing in electricity infrastructure, which saw a 19% year-over-year increase in investment during the same month.
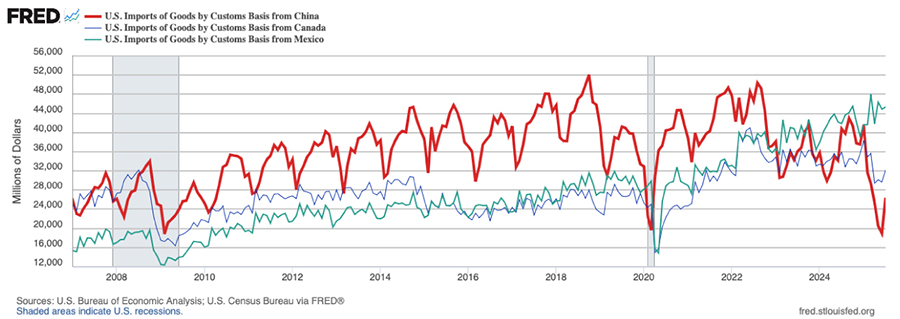
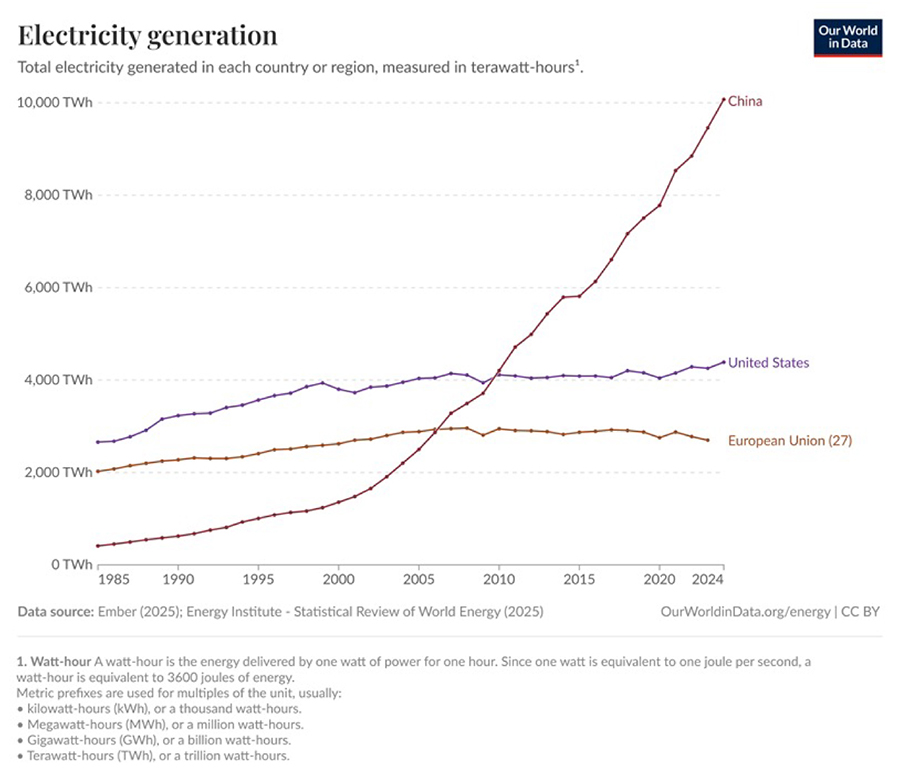
Figure 14 presents long-term electricity generation trends in the world’s three largest economies. It is clear that China’s electricity generation is growing rapidly, and coal-fired power plants account for the majority of this increase. In July 2025, China’s investment in coal mining increased by 13% year-over-year. This ongoing capacity expansion has allowed China to avoid a deeper economic downturn in spite of U.S. tariffs, weak domestic consumption, and a post-bubble real estate slowdown. It also simultaneously created a highly competitive export engine. However, absent a significant increase in demand from its two largest trading partners, the U.S. and E.U., this expansion of capacity is likely to lead to overcapacity in plant and equipment, historically the recipe for a deep recession.
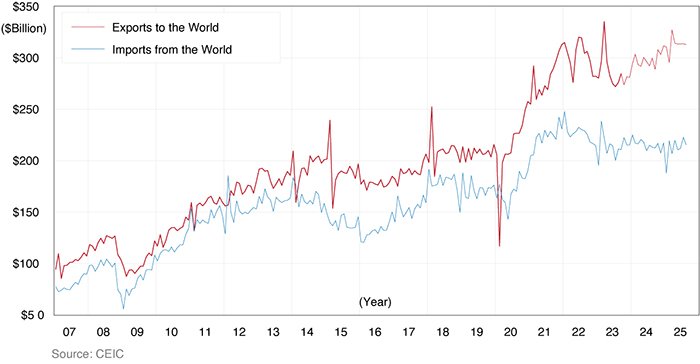
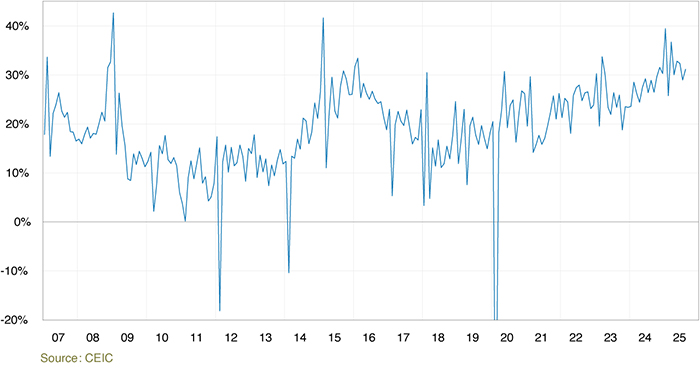
To avoid a near-term recession, China has been aggressively exporting to South and Southeast Asian countries. Figure 15 tracks China’s monthly nominal exports and imports of goods. Despite a significant decline in exports to the U.S., China’s total exports have remained strong. Moreover, China’s trade surplus, as a share of exports, has increased steadily—from 15% in 2019 to 30% in 2025—returning to its previous peak in 2015 (Figure 16). In part, China is moving up the value chain, particularly with respect to electric vehicles.
More importantly, imports have not been growing in China. Imports typically grow with household income. Chinese households are nervous about the future of the economy. Thus, the growth, or lack thereof, in the Chinese economy is not consumption generated, but rather dependent upon investment and government. The July Politburo meeting and statements by President Xi have indicated a need to boost consumption, but policy pronouncements lean towards more monetary and fiscal stimulus and a more aggressive export strategy.
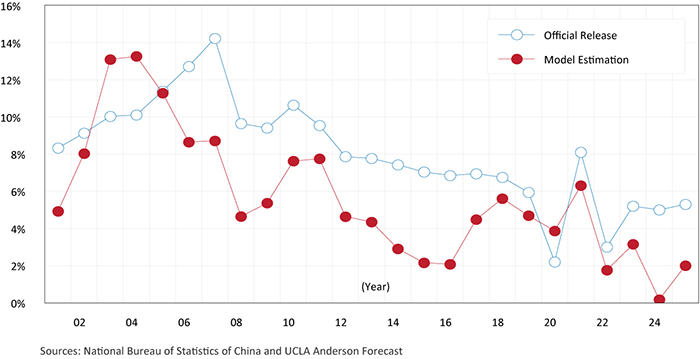
As discussed in previous reports, the UCLA Anderson Forecast has developed an alternative model for estimating China’s GDP growth using four key indicators: Energy consumption: 2.5%, CO₂ emissions: 2.1%, Total trade (exports + imports): 2.4%, Home price growth: –10%. Based on data from the first six months of 2024 and 2025, the model estimates China’s real GDP growth rate in H1 2025 to be around 2% (Figure 17), significantly below the official figure of 5.3%. The expansion of industrial capacity, therefore, masks a significant weakness and imbalance in the Chinese economy.
China’s high-investment, capacity-driven export model may be functioning in the short term, but rising debt levels serve as a warning that the model is unsustainable over the long run. Beyond the risk of a future bubble burst in manufacturing, the global community must confront a critical question: Will other countries permit their domestic manufacturing sectors to decline in the face of China’s neo-mercantilist export strategy?
Although the outlook for U.S. / China economic relations has not changed much since our last report, the rapidity of decoupling and the increase in uncertainty have created increased challenges for those engaged in trade or finance between the two. In the U.S., uncertainty about tariffs, deportations, and the shape of policy has led to weak GDP growth and increased inflation. China faces ongoing challenges related to imbalances in construction, manufacturing capacity, and debt. How policymakers in each country will address these challenges remains uncertain. Our speculation is that Chinese-owned manufacturing exporting to the U.S. will increasingly relocate to other countries and that an equilibrium in U.S. / China trade and finance will be achieved in the next few years. Nevertheless, the adjustment to fundamentally different economic arrangements in the two countries will not be without disruption costs.
Cathay Bank has commissioned UCLA Anderson Forecast to produce a U.S.-China Economic Report series that focuses on current topics affecting investment flows and associated economic events between China and the United States.
UCLA Anderson Forecast has been the leading independent economic forecast of both the U.S. and California economies for 70 years.
This report includes forecasts, projections, and other predictive statements that represent UCLA Anderson Forecast’s economic analysis and perspective on the current state and future outlook of the United States and China economies based on the available information. These forecasts take into account industry trends and other factors and involve risks, variables, and uncertainties. This information is given in summary form and does not purport to be complete. Information contained in this report should not be considered advice or recommendation for a particular course of action and does not take into account any particular business objectives, financial situation, or needs.
Readers are cautioned not to place undue reliance on the forward-looking statements. UCLA Anderson Forecast does not undertake any obligation to publicly release the result of any revisions to these forward-looking statements after the date of this report. While due care has been used in the preparation of the forecast information, actual results may vary in a materially positive or negative way. Forecasts and hypothetical examples are subject to uncertainty and contingencies beyond the control of UCLA Anderson Forecast.
Jerry Nickelsburg joined UCLA’s Anderson School of Management and The Anderson Forecast in 2006. Since 2017 he has been the Director of The Anderson Forecast. He teaches economics in the MBA program with a focus on Business Forecasting and Asian economies. He has a Ph.D. in economics from the University of Minnesota and studied at The Virginia Military Institute and George Washington University. He is widely published and cited on economics and public policy.
William Yu joined the UCLA Anderson Forecast in 2011 as an economist. He focuses on economic modeling, forecasting, and the Los Angeles economy. He also researches and forecasts on China’s economy and its relationship with the U.S. economy. His research interests include various economic and financial issues, such as time series econometrics, data analytics, stock, bond, real estate, commodity price dynamics, human capital, and innovation.

