
One way to think about U.S./China economic relations is through three lenses: cooperation on general merchandise trade, competition on technology and talent, and rivalry on geopolitics. Though each has its own dynamic, they are intertwined. For example, in the geopolitical realm, U.S. House Speaker Pelosi’s visit to Taiwan during her recent Asia trip angered Beijing and escalated the tensions between the two countries. As a result, more competition/rivalry and less cooperation between the U.S. and China appear to be in the future. These types of events create more uncertainty and, therefore, negatively impact business and investment.
Aside from the connectivity of the two economies, domestic factors affect the volume of trade. In the U.S., the Federal Reserve has been raising interest rates since last March in an attempt to cool economic growth to reduce inflation rates which recently have been the highest in four decades. Will the Fed successfully drive down the rate of inflation and navigate a soft-landing economy? Or, instead, will the cost be paid by a recession down the road? How will the tightening of monetary policy impact U.S. housing markets?
In the Chinese economy, there have been two important headwinds: the first is the ever-lasting and expanding housing bubble, which finally seems to have reached the end of its over-leveraged rope. The second is the disruption in the Chinese economy caused by the zero-COVID policy. Will China move into a low growth period or return to robust economic growth? While there are no complete answers to these questions about the U.S. and Chinese economies at this point, in this report, we examine these questions for both the domestic economies and the interactions between them.
Inflation in the U.S. is currently running at the highest level in four decades. The consumer price index (CPI) inflation rate was 8.5% on average for the 12 months ending July 2022, a decline from 9.1% in June. The decline was due to 0% inflation in the month of July. The core inflation rate, the CPI without food and energy prices, was 5.9% over the year. Even if food and energy prices were to go down in the near future, inflation rates higher than the Fed’s target rate of 2% would be with us for some time. In response, the Fed has raised the target federal funds rate range from 0% - 0.25% in March to 2.25% – 2.5% in early August (Figure 1). Tighter monetary policy has caused the money supply, M2, to begin to decline following a cumulative increase of $6.5 trillion since the beginning of the pandemic.
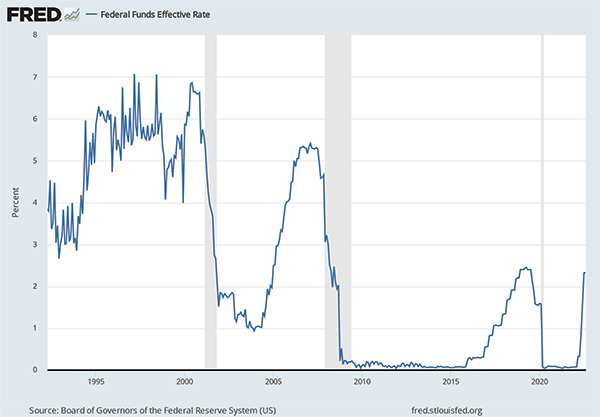
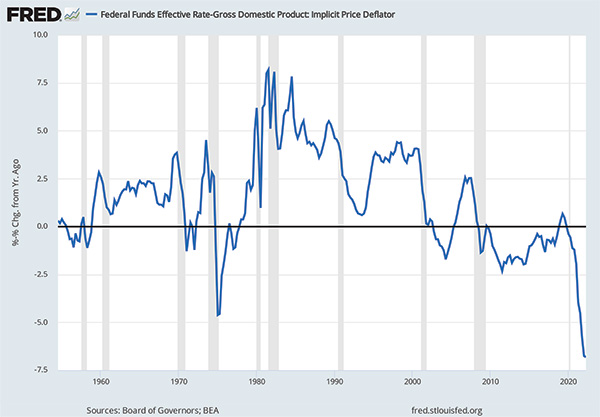
Figure 2 shows the (ex-post) real interest rate, which is the federal funds rate minus the GDP deflator and is an indicator of the real cost of funds. Prior to the Great Recession of 2008, the historical average was 1.8%. If both the real interest rate and the unemployment rate are low, then there is the possibility of demand pressures created by interest-sensitive investment inducing inflation. In that case, the equilibrium real interest rate would be higher, and interest rates would need to be raised to the equilibrium level to cause the inflationary pressures to abate. However, if the raising of interest rates creates an environment where money is too tight, that is, they are raised above equilibrium, then a recession could be induced. The problem is that the exact level of equilibrium real interest rates is not known. Moreover, the Fed looks at past inflation rates, which could be misleading if they are higher than the yet-to-be-measured contemporaneous rate. In addition, the relevant rates for investment are the long-term interest rates, and the Fed controls the short-term Fed Funds rate. Over the past three months, while the Fed has been raising the Fed Funds rate, the long rates have been relatively unchanged.
In short, the recession risk is rising because the Federal Reserve’s tool to control inflation is a blunt and non-specific tool. Depending on how inflation and interest rates evolve in the next 12 months, a recession is not a necessary outcome. One thing is certain: despite the consecutive declines of U.S. GDP in 2022 Q1 (-1.6%) and Q2 (-0.6%), the U.S. economy is not in a recession now. It is unlikely that nonfarm payroll jobs would have increased by 528,000 in July were the economy in a recession. There are alternative metrics of economic output and growth, including Gross Domestic Income (GDI). GDP and GDI are theoretically equal as they are two sides of a national balance sheet. However, they have diverged of late, and GDI is showing economic growth. A common metric to eliminate some of the measurement errors in times of rapid economic change is the average of GDI and GDP. This metric shows an economy that has been expanding, albeit more slowly, in the first half of 2022.
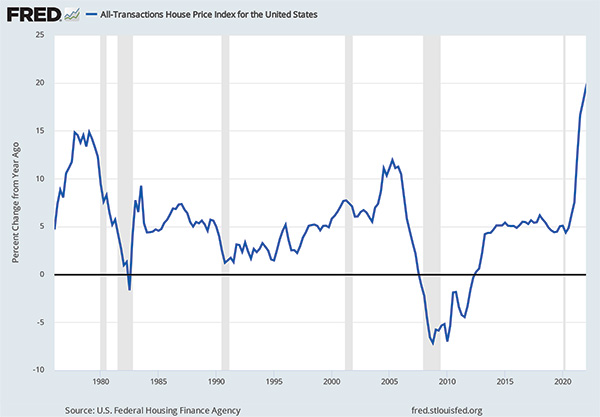
The tightening of monetary policy has elevated 30-year fixed mortgage rates to around 6%. This increased the cost for home buyers and has started to slow home sales and building activity. Existing home sales declined by 20%, and housing starts declined by 8% year over year in July. With respect to prices, recent appreciation rates were at historically high levels (Figure 3). The last run-up in home prices ended in the housing market crash of 2008. However, a similar housing slump this time is unlikely. The main reason is that the high home price appreciation of 2021/2022 was driven primarily by localized insufficient supply relative to demand, while home price appreciation prior to 2008 was driven by speculation and easily obtained subprime mortgages. Moreover, as the 2006 correction in housing markets demonstrated, soft housing markets do not necessarily lead to a near-term recession.
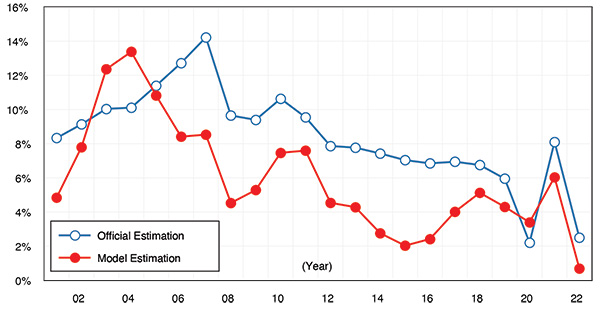
China’s economic growth is slowing down, according to China’s National Bureau of Statistics. GDP growth in Q2 2022, measured from the previous year, was 0.4%, down from 4.8% in Q1 2022. For the combined first six months of 2022, GDP grew 2.5% from the first half of 2021. The UCLA Anderson Forecast developed an alternative model to estimate China’s GDP growth. The latest model incorporates home price growth to capture the financial services sector’s contribution to GDP. Using the updated model (See Appendix), China’s GDP growth rate for the first half of 2022 is estimated to be 0.7%, considerably lower than the official Chinese estimate (Figure 4). The lower growth rate in our estimate was driven by declines in primary energy consumption, -1%, CO2 emissions, -4.1%, and home prices, -2%.
There are two main reasons for China’s weak economic performance. First, China has implemented a zero-COVID public health policy. This stringent policy has disrupted local economies across the country. For example, the complete lockdown measures in Shanghai resulted in a 13.7% decline in the city’s economy in Q2 2022. Second, the deflating real estate bubble has started to impact this important contributor to past high growth rates. A slowing economy, unsustainable development debt, and high leverage levels have created what are now being called “rotten-tail buildings,” half-finished construction projects. Many buyers who purchased homes on a presale basis, providing progress payments for developers to fund projects, have decided to engage in “mortgage strikes1.” Consequently, developers’ ability to complete the projects has been further constrained. The accumulation of non-performing loans in local banks across China is now growing to critical levels. Four rural banks in Henan province, for example, have frozen millions of dollars of deposits over the past four months, an indication of the current impact of bad debts from relentless investment in property markets over the past 20 years. According to a recent Wall Street Journal article2, some developers reported that in the first half of 2022, China’s property market tumbled into a severe depression, and their profit margins dropped significantly.
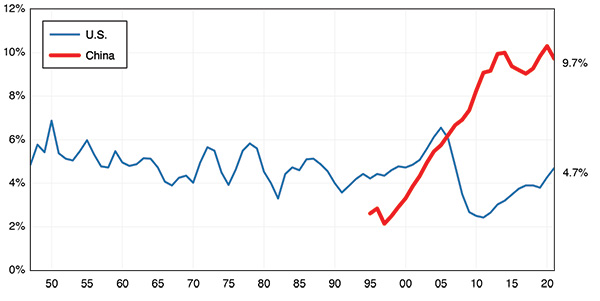
Rogoff and Yang (2021)3 estimate that real estate and related sectors account for about 30% of the Chinese economy. Figure 5 compares residential real estate investment as a percentage of GDP in the U.S. and in China. In the U.S., a simple running historical average is around 4.5% to 5%. Between 2003 and 2007, a time of speculative investment in housing in the U.S., residential investment was above average, peaking at 6.5%. In 2021, the share of housing investment was 4.7%, indicating no overinvestment. Although China might require a higher production rate than the U.S. as urbanization occurs, the “ghost cities” and “rotten-tail developments” suggest that the rate of production, persistently above 9% of GDP, has been in excess of demand requirements. This overinvestment is a bubble that has been boosting the national economy and augmenting local government finances. The current real estate crisis ought to be a significant drag on the Chinese economy in the coming years.
Since the advent of the trade war in 2018, a series of geopolitical events, including Hong Kong, Xinjiang, COVID-19, navigation in the South China Sea, and posturing in the Taiwan Straits, have added to the strains on the U.S.-China economic relationship. Among the many economic sectors affected is the tech sector, where competitive and strategic pressures have been the most intense. In addition to the series of export controls imposed over the past few years, on August 12, the U.S. Commerce Department implemented additional export controls for advanced chip design software (ECDA) and advanced materials.
Also, in August, the U.S. Congress passed the CHIPS and Science Act to revitalize American domestic manufacturing and strengthen American supply chains. This act entails $280 billion in funding for R&D and innovation in key areas, including biotech, energy, telecommunications, aerospace, and semiconductors. $52 billion of this is allocated to the semiconductor industry. The act provides a tax credit for 25% of qualified advanced manufacturing facility investment costs in the semiconductor industry between 2023 and 2026, and it prohibits the recipients of CHIPS Act funding from expanding their manufacturing in or into China.
An additional initiative, the CHIP4, was proposed by the U.S. in recognition of the fact that chips have become an increasingly important national security asset for many countries. The proposal is a strategic alliance of four global chip powerhouses: the U.S., Japan, Taiwan, and South Korea, and is an attempt to build a U.S. led semiconductor supply chain that excludes China.
Confirmation of this transformation in the U.S./China technology relationship is documented in recent research by Han, Jiang, and Mei4 (2022). They used patent data to quantify the degree of technology integration and dependence and found three distinct periods since 2000: (1) 2000 – 2009, a decade of technology integration with China’s dependence on the U.S., (2) 2010 to 2017, a decade of technology integration with China dependence on the U.S. relaxing, and (3) post-2018 a period of technology decoupling.
Besides tech decoupling, financial decoupling between the great powers is happening as well. The SEC has demanded that U.S. auditors be able to scrutinize U.S.-listed Chinese companies’ financial statements. If the U.S. cannot review a company’s financials for the most recent three consecutive years, the Chinese company’s equities would be delisted from U.S. exchanges. So far, more than 150 Chinese companies have been added to the SEC’s watchlist, including Alibaba, Baidu, JD.com, and Didi. Recently, five U.S.-listed Chinese state-owned companies, flagged by the SEC because of failing to meet U.S. auditing standards, announced that they would delist their American Depository Shares from the New York Stock Exchange. In late August, Washington and Beijing reportedly reached a preliminary agreement that would allow U.S. regulators access to audit those U.S.-listed Chinese companies. While there is some skepticism about the agreement translating into the full audits required by the SEC, were the agreement to be followed through, it would moderate or possibly turn the page on the current financial decoupling.
In spite of the tariffs on Chinese goods, we have not seen a decoupling of U.S./China trade in goods. For 2022, China is estimated to remain the fourth largest U.S. trading partner, with a total volume of $752 billion (imports: $600B, exports $152B)5. The top three are the EU with $918B, Canada with $837B, and Mexico with $794B. For U.S. imported goods, China remains the largest source country. It also has the largest current account trade surplus with the U.S. However, as we mentioned in earlier reports, global supply chains are gradually evolving, and the importance of China to the U.S. and the U.S. to China in international trade, while remaining large in the future, will be somewhat diminished.
These trends may be mitigated if proposals to reduce tariffs on some Chinese goods as a way of reducing prices and, therefore, inflation now being debated within the Biden Administration become a reality. Will this be an effective policy? The answer lies in a concept that economists call the incidence of the tariff. In the case of imported goods that are not price sensitive, such as PPE in the first half of 2020 or goods whose prices are determined in world markets, tariff costs can be pushed onto the consumer through higher prices. For these goods, lowering or eliminating the tariff will effectively lower the price. For goods that are price sensitive, the Chinese supplier would not have been able to push the tariff costs through to consumers, and therefore the incidence would have fallen on the supplier, and one would expect a reduction in exports to the U.S.
Examining the trade data from 2018 to 2021 yields a mixed picture. For forestry products, textile mills products, printed matter, chemicals, rubber and plastics, fabricated metals, electronics, and miscellaneous manufactured goods, the tariffs do not seem to have caused a significant reduction in Chinese exports to the U.S. An important portion of these are intermediate goods in the production process. For example, Foxconn assembles iPhones from components imported into China and then exports them to the U.S., and apparel manufacturers import cotton for textile production and export them for finishing. While the tariffs raise costs, these higher costs are only a part of the total costs of the finished product. For all other product categories, there was a significant reduction in exports to the U.S., and the reduction in these sectors led to a significant reduction in overall trade. A case can be made that an easing of the tariffs will result in lower prices for some products produced or partially produced in China. The open question going forward is, would the impact on inflation be enough to overcome the political inertia currently behind retaining the tariffs?
In the U.S., the Fed is facing a tough dilemma: (1) if they raise interest rates too much, this could cause a recession lowering economic activity and causing unemployment, and (2) if they raise interest rates too little, the impact on inflation will be marginal. In the most recent FOMC statement, the Fed said they would continue reducing their holdings of Treasuries and mortgage-backed securities, and the Fed is strongly committed to returning inflation to its 2% objective. While the Fed is hopeful it can avoid both (1) and (2), the uncertainty associated with Fed policy cannot but have a negative economic impact.
In China, the real estate crisis and zero-COVID public health policy are at the heart of its current economic problems. In recognition of this, and in spite of interest rates rising worldwide, China’s central bank cut a key interest rate this past August. Nevertheless, China remains the largest manufacturer and exporter in the world. Its share of global exports by value increased from 12.7% in 2018 to 15.1% in 2021. Decoupling is happing with some speed in technology, possibly less rapidly in finance, and slowly in trade. Though U.S./China economic relations are deteriorating, they remain large, important, and barring an unexpected geopolitical event, which will continue to be so over the next few years.
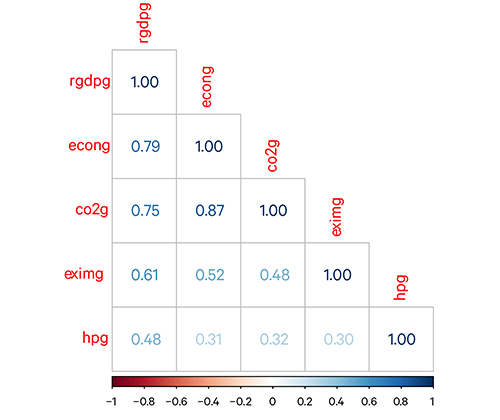
In our U.S./China Economic Report: 2022 Annual Report in February, we published a simple, consistent, and alternative measurement of China’s real GDP growth. Unlike typical national GDP accounting, which computes hundreds of GDP components, our simple model used only three variables: (1) energy consumption (econog), (2) CO2 emissions (co2g), and (3) international merchandise trade amount (eximg).
All three input variables are statistically significant predictors for the real GDP growth rates during the period of 2001 to 2019 for the 14 largest economies in the world: Australia, Brazil, Canada, France, Germany, India, Italy, Japan, Mexico, Russia, South Korea, Spain, U.K., and the U.S. including developed, emerging, and developing countries. We suggest these input growths will be a good predictor of China’s GDP growth as well.
Given growing concerns about deflating China’s real estate bubble, we test whether a housing market indicator is a significant predictor of the GDP growth of a country. We find evidence that a simple variable — nominal housing price growth6 (hpg) is a significant predictor. With the home price growth variable, we could capture financial service-related activities not included in the other three variables.
The estimation of our four-variable pooling OLS model is as follows (R-squared=0.72):
Compared to our original three-variable pooling OLS model as follows (R-squared=0.69):
A simple correlation between all the variables in the model:
Cathay Bank has commissioned UCLA Anderson Forecast to produce a U.S.-China Economic Report series that focuses on current topics affecting investment flows and associated economic events between China and the United States.
UCLA Anderson Forecast has been the leading independent economic forecast of both the U.S. and California economies for 70 years.
This report includes forecasts, projections, and other predictive statements that represent UCLA Anderson Forecast’s economic analysis and perspective on the current state and future outlook of the United States and China economies based on the available information. These forecasts take into account industry trends and other factors and involve risks, variables, and uncertainties. This information is given in summary form and does not purport to be complete. Information contained in this report should not be considered advice or recommendation for a particular course of action and does not take into account any particular business objectives, financial situation, or needs.
Readers are cautioned not to place undue reliance on the forward-looking statements. UCLA Anderson Forecast does not undertake any obligation to publicly release the result of any revisions to these forward-looking statements after the date of this report. While due care has been used in the preparation of the forecast information, actual results may vary in a materially positive or negative way. Forecasts and hypothetical examples are subject to uncertainty and contingencies beyond the control of UCLA Anderson Forecast.
Jerry Nickelsburg joined UCLA’s Anderson School of Management and The Anderson Forecast in 2006. Since 2017 he has been the Director of The Anderson Forecast. He teaches economics in the MBA program with a focus on Business Forecasting and Asian economies. He has a Ph.D. in economics from the University of Minnesota and studied at The Virginia Military Institute and George Washington University. He is widely published and cited on economics and public policy.
William Yu joined the UCLA Anderson Forecast in 2011 as an economist. He focuses on economic modeling, forecasting, and the Los Angeles economy. He also researches and forecasts on China’s economy and its relationship with the U.S. economy. His research interests include various economic and financial issues, such as time series econometrics, data analytics, stock, bond, real estate, commodity price dynamics, human capital, and innovation.

