
The election is over with and there will be a change in administrations come January 20th. However, that does not eliminate all of the uncertainty with respect to U.S. economic policy. There could well be a divided Congress, and the outgoing administration may have some new directives that were not previously forecast. However, over the past two years, in a country that has harbored divided views on domestic policy, a rare consensus on a fundamentally changed view of U.S. economic engagement with Beijing has developed.
As we mentioned in previous reports, the U.S. and China are unlikely to go back to the past era of strategic engagement. What a Biden Administration would change with respect to economic policy towards China is in style and method, not substance. The U.S. is more likely to confront and contain China by leveraging more multilateral frameworks with its allies than unilateral ones. One example is that the U.S. could re-enter the CPTPP (Comprehensive and Progressive Agreement for Trans-Pacific Partnership) to bolster its leadership and to expand its interests in Asia. The U.S. could also re-join the WHO and make the WTO more functional as well. And the President-Elect has stated that America would return to the Paris Accord and seek cooperation on climate change issues with China. Though China was the largest CO2 emitter in the world in 2020, it recently committed to carbon neutrality prior to 2060. This is a rare space for increased cooperation in alternative energy and propulsion.
To be sure, there will be more dialogues and efforts between the U.S. and China to address further escalating tensions. In the presidential campaign, however, President-Elect Biden committed to bringing manufacturing, particularly with respect to technologically advanced goods and renewable energy equipment, back to the U.S.1 Thus, a continuation of the intention, if not the method of the past four years of partial economic disengagement should be expected. In this update report, we will discuss trade relations and technology competition between the U.S. and China.
Figure 1 (left) shows U.S. nominal goods trade with the rest of the world (imports plus exports). Figure 1 (right) shows U.S. nominal goods trade deficits with the rest of the world (imports minus exports). The numbers in 2020 are based on Anderson Forecast projections. Due to the global pandemic induced recession, it is not surprising to see that U.S. total international trade is estimated to decline by 12% in 2020. In the 2008/2009 recession, the comparable decline in total trade was 19.8%. In both recessions, the circumstances of the downturn interrupted trade flows. In the latest, imports from China to the U.S. plummeted as Chinese factories shutdown and did not pick up until both they and U.S. factories began to reopen. Consequently, the slight decline in the U.S. goods trade deficit should not be taken as an indicator of a trend. Indeed, the deficit widened in the third quarter of 2020.


Note that trade data in Figure 1 only includes goods. We use it for convenience for Figures 1 through 4 because data from the U.S. Bureau of the Census on monthly trade flows by country is available through September 2020, while the net export component of GDP that includes trade in services is only available by country with a considerable lag. For a more comprehensive picture of international trade, we should, of course, also examine trade in services including travel, education, and intellectual property transactions. We do not expect this to show a qualitative difference, however, as the estimated total trade of goods and services should decline by 14% in 2020, similar to the goods only decline (Figure 1A). The trade deficit in goods and services is estimated to have increased by 9% in 2020 with the difference being largely the collapse of international travel and the restrictions on international students coming to the U.S.
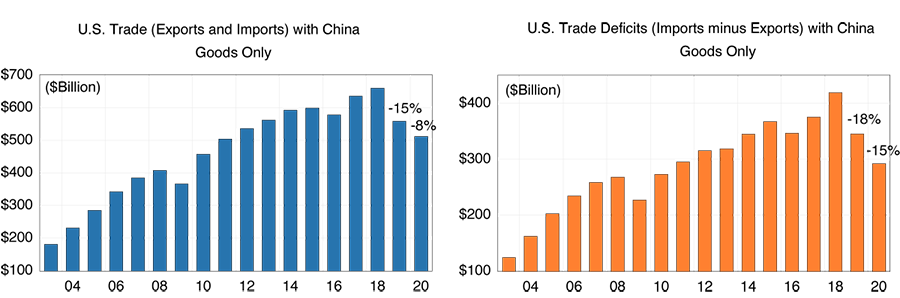

Figure 2 (left) shows total U.S. nominal goods trade with China and Figure 2 (right) shows the U.S. goods trade deficit with China. We can see a clear turn in 2019. U.S. total goods trade with China declined by 15% in 2019, and we estimate that it will decline by another 8% in 2020. U.S. trade deficits with China contracted by a greater amount (-18% in 2019 and an estimated -15% in 2020). The main driver of the differential from the decline in world trade in 2019 and to some extent in 2020 is in the reduction of U.S. imports from China due to tariffs, non-tariff restrictions on trade, and a shift of low-cost labor manufacturing out of the now higher cost China. U.S. imports from China peaked in 2018 at $538 billion, dropped to $452 billion in 2019 (-18%), and to an estimated $402 billion in 2020 (-15%). It should be noted that weak U.S. holiday spending could further the reduction in imports into 2021.
While the total U.S. goods trade deficits decreased slightly (Figure 1), the deficit with China decreased significantly (Figure 2). In contrast to consecutive annual declines in the goods trade deficit with China, U.S. goods trade deficits increased with all other countries by growth rates of 12% in 2019 and 8% in 2020 (Figure 3). This is evidence of U.S.-China decoupling since 2019.
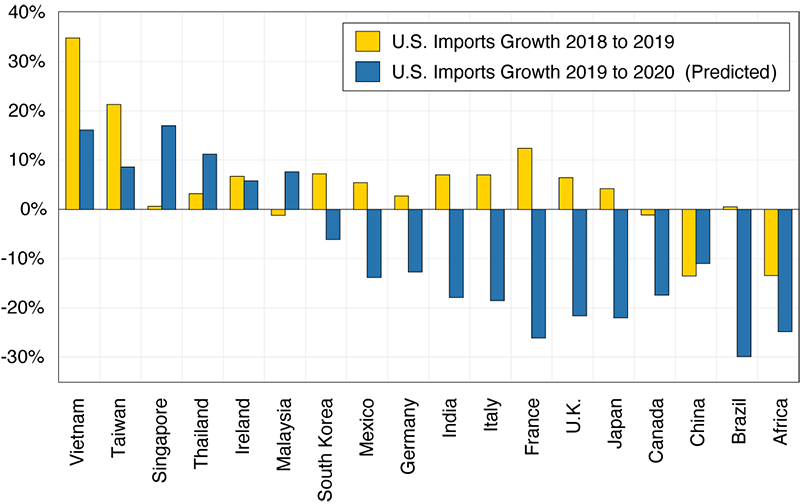
Figure 4 presents U.S. import growth from its major trading partners in 2019 (yellow bar) and 2020 (blue bar, estimated). The two gaining the most are Vietnam and Taiwan, both of which have experienced positive export growth to the U.S., including during the current pandemic induced recession year. Singapore, Thailand and Malaysia also have had some modest positive growth in 2020. Much has been said about India becoming the next China due to its reinforced strategic alliance with the U.S. and much lower labor and land costs.2 But U.S. imports from India declined in 2020. Fundamental change in supply chains take time, and we still expect a China to India shift as part of the decoupling.
Globalization has been long praised by Wall Street, Chambers of Commerce, and economists with its “just-in-time” supply chains providing low inventory costs, maximizing shareholder value, and generating more affordable products.3 The global pandemic led many to realize that just-in-time global supply chains are fragile, and that they can potentially lead to national security and public health consequences. Though having a higher marginal cost, “just-in-case” supply chains are risk reducing with larger inventories and alternative domestic sources of production inputs. It is then natural to expect both China and the U.S. to enact policy to make sure there will be sufficient products and capacity at home in case of crises, disasters, conflicts, and/or another pandemic.
In late October 2020, the Chinese Government published the major economic development targets in the 14th Five-Year Plan (2021-2025). Among many goals is “technology self-reliance.” This is both in response to escalating U.S.-China rivalry, various U.S. sanctions on Chinese tech companies, and as part of China’s 2016 “Made in China 2025” initiative. The strategic goals of “Made in China 2025” and “China Standards 2035” have China making major public investments in domestic technology and innovation including advanced technologies such as AI, quantum computing, semiconductor, life science, and aerospace.
Recently, President Trump issued an executive order banning U.S. residents from investing in 31 Chinese companies that are purported to engage in “military-civil fusion” activity. The order is to take effect in January 2021. Existing American investment will need to be divested by November 2021. These 31 companies include Huawei, China Mobile, Hikvision, and Aviation and Industry Corporation of China (AVIC). Several of these companies are already in the Department of Commerce’s Entity List and 13 of them are publicly traded.
In a report sponsored by the Hinrich Foundation4 entitled “Strategic U.S.-China Decoupling in the Tech Sector,” Alex Capri (2020)5 suggests six major trends that will emerge from the tech competition between the U.S. and China:
What is the early evidence on Points 1 and 3? About 500 of some 22,000 commodity classifications in U.S. merchandise trade are identified as advanced technology.6 Focusing on two specific sectors: (1) imports of information and communication products, and (2) exports of aerospace, have the largest trade values among all the advanced technology products. Figure 5 lists the top 10 trading regions for U.S. import sources of information and communication products in 2018, 2019, and 2020.7 The U.S.’ top source of information and communication products is China. The trade war, tariffs, and Great Powers competition in the past two years have started a U.S.-China decoupling, in which U.S. imports from China declined from $157 billion in 2018 to $124 billion in 2019, and to $113 billion in 2020. At the same time, U.S. imports from Vietnam, Taiwan, South Korea, and Thailand all increased.
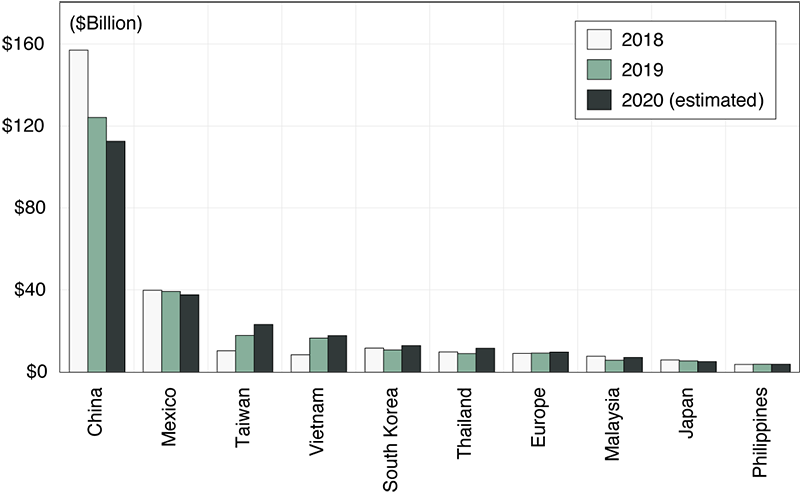
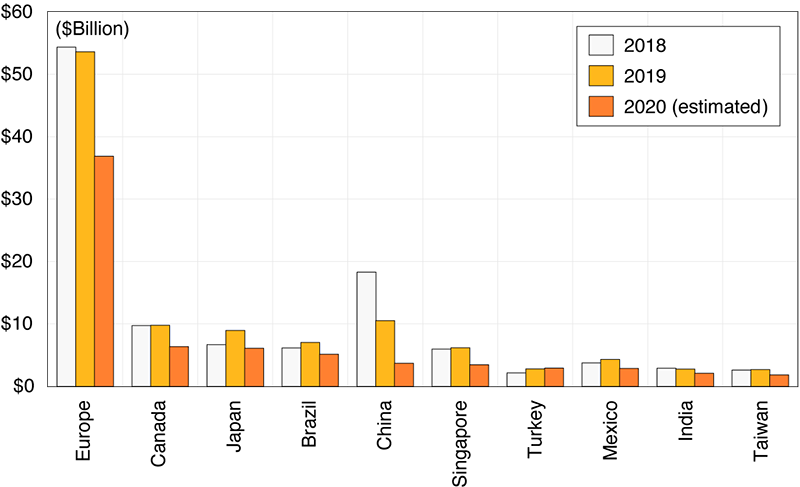
Figure 6 illustrates the top 10 trading regions for U.S. exports of aerospace products in 2018, 2019, and 2020. In 2020, due to the pandemic and disruption of the airline industry, we see across-the-board decline of U.S. exports. China was a major purchaser of Boeing airplanes before the 737 MAX grounding and the COVID-19 pandemic. We can see a dramatic decline of exports to China from $18 billion in 2018 to $11 billion in 2019, and $3.7 billion in 2020. Though the 2020 decline is across all regions, the 2019 is more specifically a decline in exports to China.
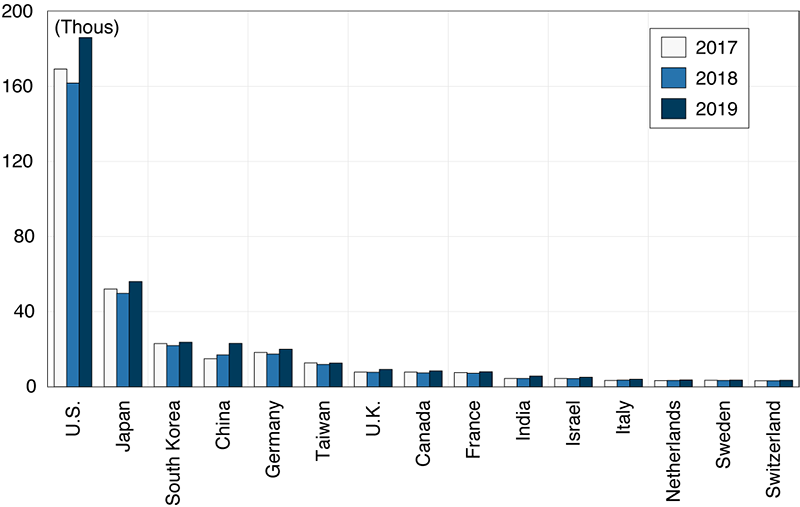
Although it is generally recognized that the U.S. is further along in technology development and innovation than China, that gap has been closing. The number of patents is one way to measure innovation and technology advances of a country. Figure 7 lists the number of patents granted by the U.S. Patent and Trademark Office to individuals or companies by their country of origin. The U.S. is, of course, at the top with the most patents granted (186,000 in 2019), followed by Japan with 56,000, South Korea with 23,600, and China with 23,000. Although China’s number is low compared to the U.S., it has had historically high growth rates. From 2017 to 2019 filings at the U.S. Patent Office grew from 14,900 to 23,000: a 55% increase. Over the past two years, China surpassed Germany in the of number of patents issued in the U.S. Beyond the U.S. market, through Patent Cooperation Treaty System (PCT) at World Intellectual Property Organization (WIPO), China (58,990) has surpassed the U.S. (57,840) as the top country for international patent applications in 2019. Recent moves to restrict Chinese technology exports to the U.S. is expected to reverse the trend in patents filed in the U.S. by Chinese companies, but not the trend in the number of patents issued beyond in the world market. The reversal will be exacerbated if the implementation of “China Standards 2035” results in different technology protocols than are used in the U.S.
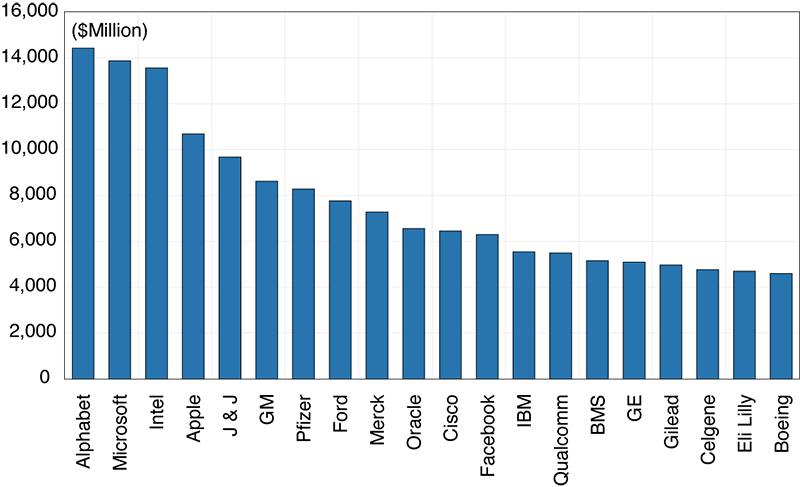
One area where China is lagging the U.S. in technology development is in R&D expenditures. To be sure, local cost differentials make comparisons of R&D across countries only suggestive. However, the 14th Five Year Plan explicitly recognizes the differential illustrated below. Figure 8 lists the top 20 companies in the U.S. with the most R&D expenditures in 2016. The top American companies were Alphabet (Google), Microsoft, Intel, and Apple.
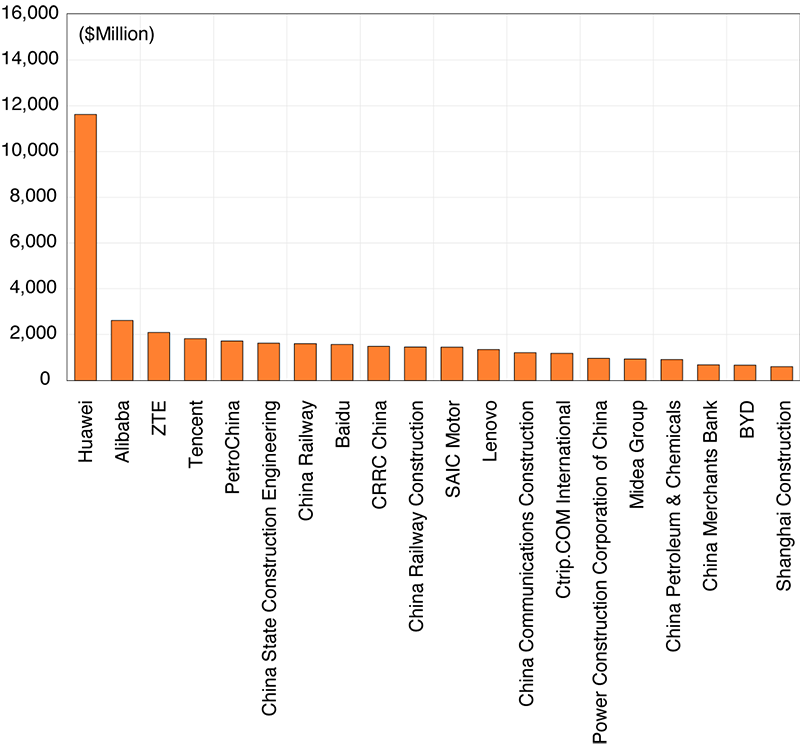
Figure 9 shows the top 20 Chinese companies with the most R&D expenditures in 2016. The top four are Huawei, Alibaba, ZTE, and Tencent. However, besides Huawei8 and PetroChina, the technology prowess in terms of R&D in these top 20 Chinese firms are still lagging far behind the top 20 in the U.S.. Note that these numbers only reflect company R&D, not reflective of government R&D. According to OCED, R&D expenditures in whole China in 2018 was about $468 billion, still lower than $582 billion of the U.S., but higher than $465 billion of whole 28 EU countries.
How this will change in the coming years is well illustrated by the case of Huawei. Huawei is the leading tech company in China and the largest communication equipment maker in the world, and it has become a target of U.S. actions. Following an accusation of Huawei stealing trade secrets from six American companies, the U.S. with its allies, Australia, U.K., Japan, India, and Brazil, have banned or restricted Huawei’s communication equipment because of security concerns. In addition, the U.S. expanded its export control requirements, the Foreign Direct Product Rule (FDPR) in May 2020. Now, foreign companies are required to get a license before selling finished products if the manufacturing process involves certain American software, design, tooling and equipment.
The action involves a crucial player in the tech/semiconductor supply chain: Taiwan Semiconductor Manufacturing Company (TSMC), the world’s largest contract chipmaker. If TSMC is not allowed to sell to Chinese companies such as Huawei, there would be a big hole in China’s tech value supply chain and its technology ambitions. As yet there are no Chinese semiconductor companies that can produce the required high-quality microchips. HiSilicon, Huawei’s fabless chip designer for smartphones and 5G infrastructure, relies on TSMC for chips. According to Capri (2020), TSMC depends on U.S. semiconductor manufacturing technology from Applied Materials, LAM research, KLA Tenor, Synopsys, and Cadence Design Systems; companies that control a majority of the global market. With the U.S. imposed FDPR, TSMC cannot make cutting edge chips for HiSilicon and Huawei.
Note that TSMC currently makes computer chips used in Lockheed Martin F-35 fighter jet and is a key supplier for Apple, AMD, Qualcomm, Broadcom, and Nvidia. Washington has pressured TSMC to produce the chips that are used inside U.S. military hardware within the U.S. in order to ensure U.S. tech supply chains are free from any Chinese interference. TSMC has decided to invest $12 billion to set up a wholly-owned subsidiary in Arizona in 2021. This is a further example of manufacturers diversifying supply chains from “just-in-time” to include “just-in-case”, and though it involves a Taiwanese company, it has direct implications for China as well.
Cathay Bank has established a sponsorship relationship with UCLA Anderson Forecast to produce a U.S.-China Economic Report. In this report, UCLA Anderson Forecast will talk about their view of economic analysis and perspective on the current and future outlook relating to the two largest economies in the world – the United States and China.
UCLA Anderson Forecast has been the leading independent economic forecast of both the U.S. and California economies for over 65 years. The annual report and quarterly columns written by UCLA Anderson Forecast will focus on current topics affecting investment flows and associated economic events between China and the United States.
This report includes forecasts, projections and other predictive statements that represent UCLA Anderson Forecast’s economic analysis and perspective on the current state and future outlook of the economies of The United States and China in light of currently available information. These forecasts are based on industry trends and other factors, and they involve risks, variables and uncertainties. This information is given in summary form and does not purport to be complete. Information in this report should not be considered as advice or a recommendation to you or your business in relation to taking a particular course of action and does not take into account your particular business objectives, financial situation or needs.
Readers are cautioned not to place undue reliance on the forward-looking statements in this report. UCLA Anderson Forecast does not undertake any obligation to publicly release the result of any revisions to these forward-looking statements to reflect the occurrence of unanticipated events or circumstances after the date of this report. While due care has been used in the preparation of forecast information, actual results may vary in a materially positive or negative manner. Forecasts and hypothetical examples are subject to uncertainty and contingencies outside UCLA Anderson Forecast’s control.
Jerry Nickelsburg joined the UCLA’s Anderson School of Management and The Anderson Forecast in 2006. Since 2017 he has been the Director of The Anderson Forecast. He teaches economics in the MBA program with a focus on Business Forecasting and on Asian economies. He has a Ph.D. in economics from the University of Minnesota and studied at The Virginia Military Institute and George Washington University. He is widely published and cited on issues related to economics and public policy.
William Yu joined the UCLA Anderson Forecast in 2011 as an economist. At Forecast he focuses on the economic modeling, forecasting and Los Angeles economy. He also conducts research and forecast on China’s economy, and its relationship with the US economy. His research interests include a wide range of economic and financial issues, such as time series econometrics, data analytics, stock, bond, real estate, and commodity price dynamics, human capital, and innovation.

